
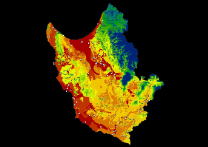
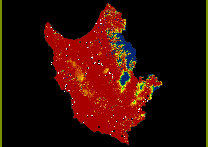
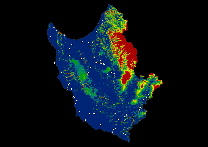
Results
Output maps from the Dempster-Shafer method in IDRISI can be seen in the Picture Gallery along with maps of the variables used.
Kvamme's gain statistic (Kvamme, 1988) was used to determine the effectiveness of the model.
It is calculated as (1 - % area / % sites). Values range from 0 to 1, with higher values indicating better performance (Kuiper and Wescott 1999).
"Predictive model 'performance' is the degree to which a model correctly predicts the presence or absence of archaeological sites. This does not mean the presence or absence of new, independently collected data. In fact, in most cases performance is only measured using the data set that was collected for setting up the model." (Verhagen 2007, p116).
In this model test data is available in the form of the 10 sites which were retained at the beginning of the process. There is also another set of new data which can be added to test the model. These are find spots, totaling 17, which were not included in the model as they referred to locations where only a few diagnostic artefacts were recovered. It is however more than likely that some if not all of these find spots were in fact located at, or close to a prehistoric site.
At present Kvamme's gain statistic appears to be the only one extensively used in predictive modeling applications.
The results from the gain statistic tests show that the introduction of the 10 test data sites as well as the 17 find spot locations does little to alter the high belief in 'site' score. However the introduction of land classification bias does alter the result and reduces the value to 0.55 from 0.69. Although 73 out of the 75 sites are still located in the high belief range the increase in high belief cells means that the score is lowered and that the model performs worse. This at least illustrates the impact additional information can have on a DST-based model.
There is some debate as to the gain value at which a model can be classed as being a high performer. Verhagen (2007) reviewed several predictive model projects and found that some scholars believe that gain values of around 0.5 are typical for good working models, whilst others believe a value of 0.8 to be more realistic for a high performer. He also doubts whether very high gains are attainable goals for many predictive models.
A gain statistic of 0.69 would therefore appear to indicate a model with high performance, but there is an important issue which may affect the validity of the model.
"The use of medium probability zones poses an additional problem for model performance assessment. Because these are zones of no predictive power, they mainly serve to minimize the zones of high and low probability. The gain of the high and low probability zone will then always be inflated, and will not give a good impression of the performance of the whole model - in the end, we are not particularly interested in a model where the majority of the study area is medium probability." (Verhagen 2007, p135).
The percentage of cells which fall into this medium category for the belief in 'site' (without bias) is 39%. This value may therefore adversely affect the performance of the model. van Leusen (2009, p151) states that "models should attempt to keep the share of the 'medium' range as small as possible."
It is hoped that future adjustments of the model, preferably with the addition of new lines of evidence and with improved datasets, could address this issue.